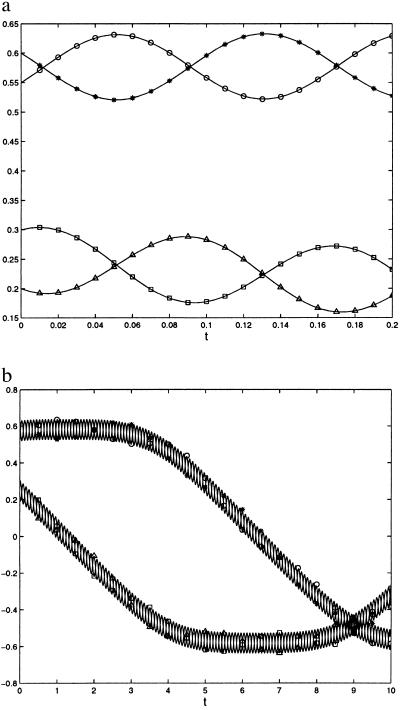
Figure 3.
Mean evolution of the coarse variables, p̄1 (▵), p̄2 (□), q̄1 (∗), and q̄2 (○). The symbols represent the mean evolution of an ensemble of initial conditions generated by means of a Monte Carlo algorithm. The solid lines are the solutions obtained by integrating the mean time derivatives (Eq. 28). The two graphs show different time intervals: (a) t = 0 − 0.2; (b) t = 0 − 10.

