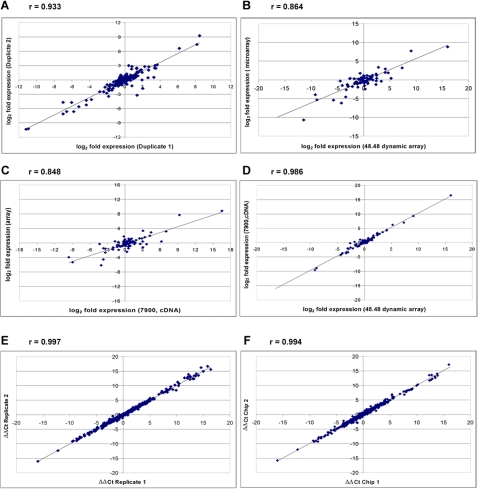
Figure 2. Comparisons of data.
The correlation coefficient r is shown above each plot. For details regarding these comparisons see Materials and Methods. A. Comparison of Duplicate samples from the GeneNote database[10] for 45 genes and two tissues, heart and liver. B. Comparison of data from the 48.48 dynamic array obtained for preamplifid cDNA (PA cDNA) and data from the GeneNote database for the same genes and tissues. C. Comparison of the data from the 7900HT Sequence Detection System obtained with cDNA and data from the GeneNote database. D. Comparison of data from the 7900HT obtained with cDNA and the 48.48 dynamic array obtained with PA cDNA for the same genes and tissues. E. Comparison of the ΔΔCT values for replicates on one of the 48.48 dynamic array chips used for gene expression analysis for all 44 genes and 18 tissues. F. Pair-wise comparison of the mean ΔΔCT values from two chips for the same 44 genes and 18 tissues.

