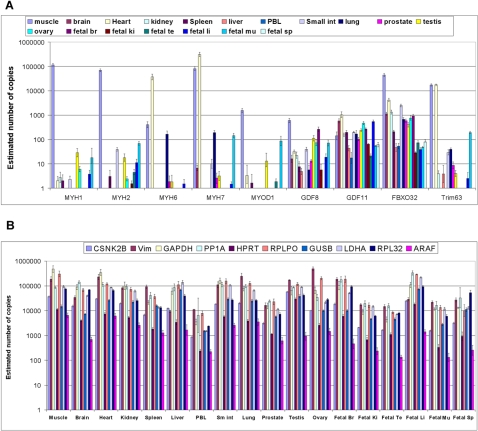
Figure 3. Estimated copy numbers.
Using the standard curve shown in Fig. S2 the actual number of copies in the reaction chambers was estimated from the mean CT values of all the data obtained on the three chips used previously. The data is plotted as the log10. Error bars were determined from the mean CT values +/−one standard deviation. The raw data for the standard curve in Figure S2 is presented in Table S4.

