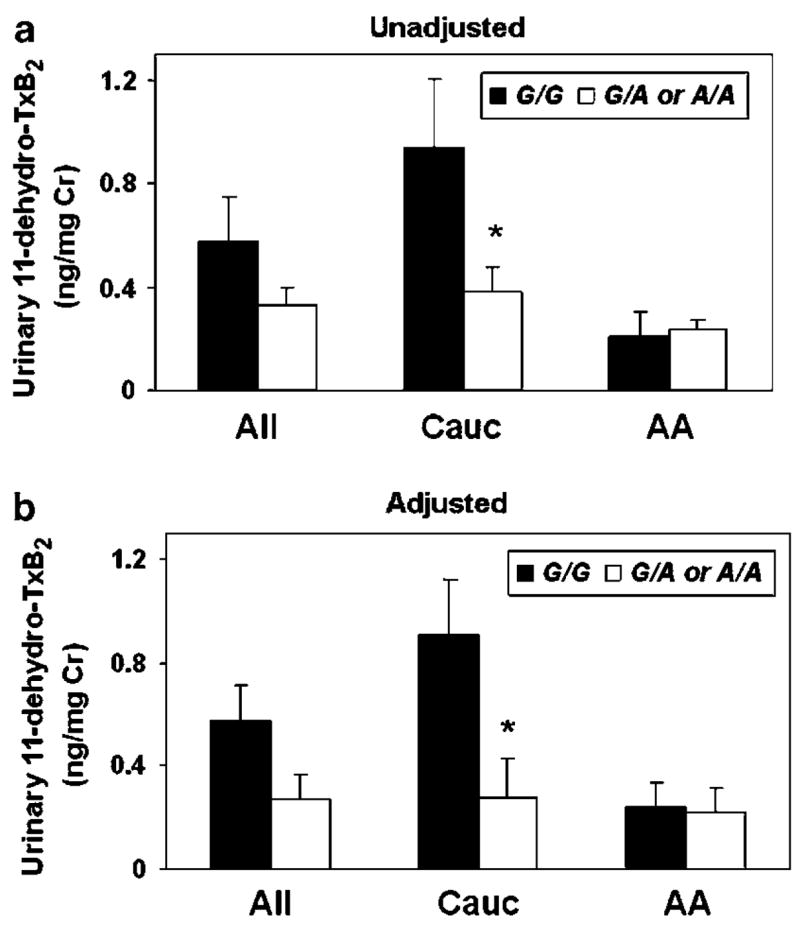
Figure 1.

(a) Unadjusted and (b) adjusted mean±SEM urinary 11-dehydro-TxB2 concentrations, normalized to milligrams of urinary creatinine (Cr), are presented according to G-1006A genotype as wild-type (G/G) (black bars) and variant (G/A or A/A) (white bars). Data are presented separately for all participants (All, n = 33) and stratified by race (Cauc = Caucasians, n = 20; AA = African Americans, n = 13). *P<0.05 versus wild type. The values presented in b were adjusted for age, gender, race, PTGS2 G-765C genotype, CHD or stroke case status, and aspirin/non-steroidal use at the time of sample collection, using least squares regression.
