
Fig. 3. Ligand binding density analysis of HuR oligomers on the Fl-ARE38 substrate.
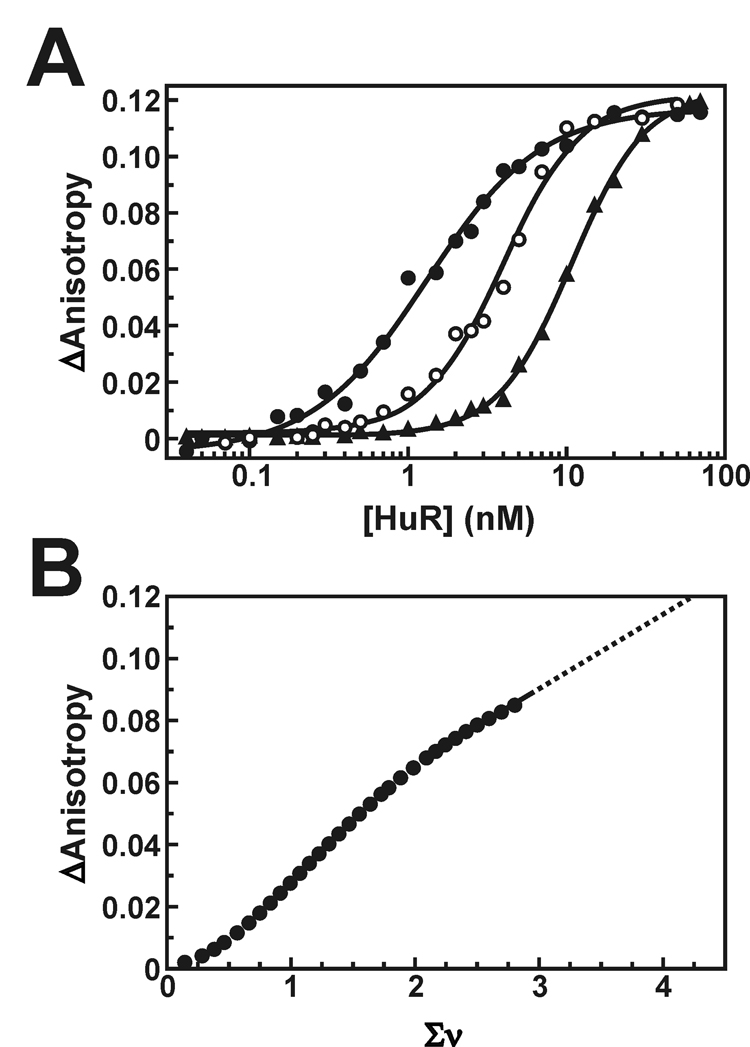
A, anisotropy plots showing HuR binding across vaying concentrations of the Fl-ARE38 substrate (0.2 nM RNA, solid circles; 1 nM RNA, open circles; 5 nM RNA, triangles). The solid lines are nonlinear least squares fits to cooperative Hill isotherms using Equation 3. The average increase in fluorescence anisotropy at binding saturation (ΔAmax) is 0.119 ± 0.003. B, the HuR-dependent change in measured anisotropy (ΔA) was calculated as a function of average number of bound HuR molecules per RNA strand (Σν) as described under “Experimental Procedures”. For clarity, only every third point is shown. The solid line is a linear least squares interpolation and has no theoretical basis. The dotted line is an extrapolation to the maximal anisotropy shift observed in A, estimating the Σνsat at 4.2 ± 0.2. This value was used to calculate the site size for saturated HuR binding to the Fl-ARE38 RNA substrate (see text).