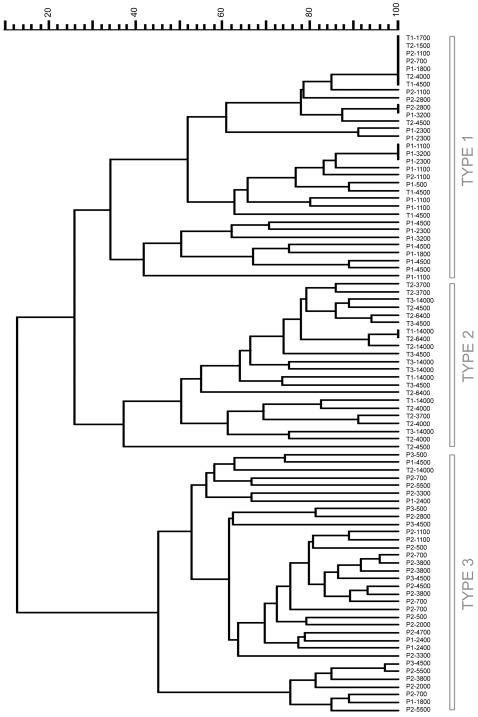
Figure 7. Extended dendrogram of the DLN histopathological profiles.
Each label indicates (in order): Infecting species (P for Y. pestis, T for Y. pseudotuberculosis), time post-injection (in days), amount of injected cfu. Top scale = % similarity. As compared to Figure 5, an extended range of infective-loads was used, and hence more DLNs were included in the analysis (see the Result section). The seven last profiles in the dendrogram correspond to completely destroyed lymph nodes.

