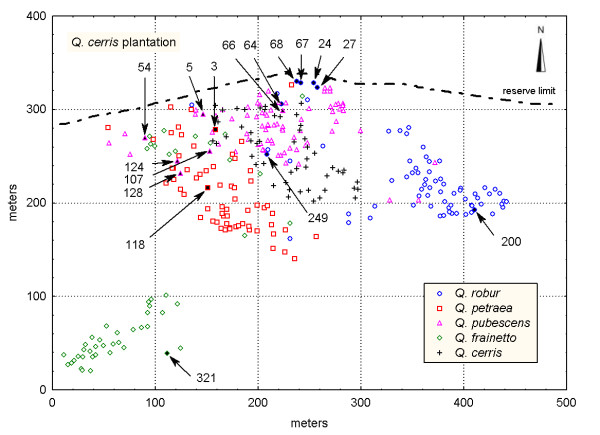
Figure 2.
Spatial distribution of phenotypically pure species and intermediate individuals in the study plot. Each species is shown by a different shape and colour. Phenotypically intermediate individuals are indicated by arrows and filled forms. Shape and colour of symbols correspond to the species they mostly resemble.

