
Figure 4.
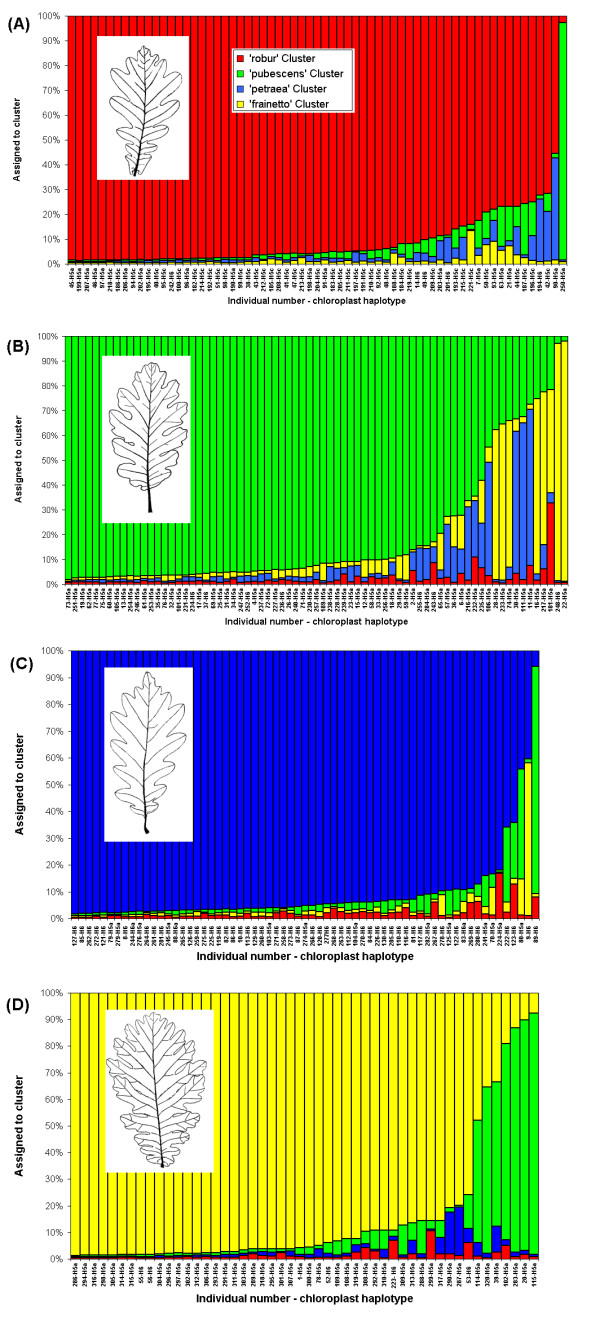
Results of the genetic assignment based on the Bayesian method implemented in the program STRUCTURE. Individuals are grouped according to their physical appearance – only the phenotypically pure species are shown: (A) – Q. robur, (B) – Q. pubescens, (C) – Q. petraea, (D) – Q. frainetto. Each individual is represented by a thin vertical line, which is partitioned into 4 coloured segments that represent the individual's probability of belonging to the cluster with that colour. Tree number and chloroplast DNA haplotype are given.