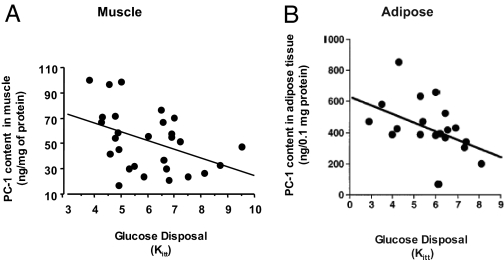
Figure 3.
Correlation between muscle and adipose PC-1 levels with in vivo insulin action. A, Correlation between PC-1 content in skeletal muscle of 28 nonobese, nondiabetic subjects and in vivo insulin sensitivity measured by the iv insulin tolerance test Kitt (51) (r = 0.51, P < 0.035) and positively correlated with plasma insulin levels. B, Correlation between PC-1 content in human adipose tissue of 19 nonobese, nondiabetic subjects and in vivo insulin sensitivity as indicated by Kitt values. PC-1 content negatively correlated with insulin sensitivity (r = −0.57, P = 0.011) and positively correlated with plasma insulin levels. [Panel A adapted from L. Frittitta et al.: Diabetologia 39:1190–1195, 1996 (51) with kind permission from Springer Science and Business Media. Panel B adapted from L. Frittitta et al.: Diabetologia 40:282–289, 1997 (62) with kind permission from Springer Science and Business Media.]

