Figure 4.
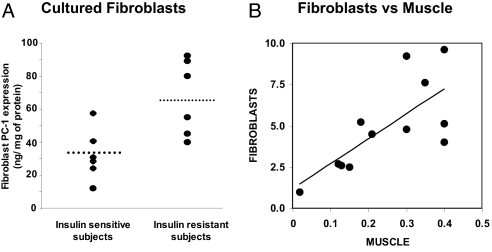
Fibroblast PC-1 levels. A, PC-1 content in cultured human skin fibroblasts from “normal” (healthy nonobese, nondiabetic) subjects with different insulin sensitivity (n = 12). Primary cultures of fibroblasts were established from 4-mm forearm skin biopsies. Horizontal bars indicate mean values. P = 0.01, sensitive vs. resistant subjects. B, Correlation between PC-1 content in cultured human skin fibroblasts from “normal” (healthy nonobese, nondiabetic) subjects and PC-1 content in skeletal muscle obtained from the same subjects. Over a wide range of PC-1 values, the content of PC-1 in skin fibroblasts closely reflected its content in muscle tissue (P = 0.01). [Panel A adapted from Frittitta et al.:Diabetes 47:1096–1100, 1998 (63) with permission from The American Diabetes Association. Panels A and B adapted from Goldfine et al.: Ann NY Acad Sci 892:204–222, 1999 (56).]

