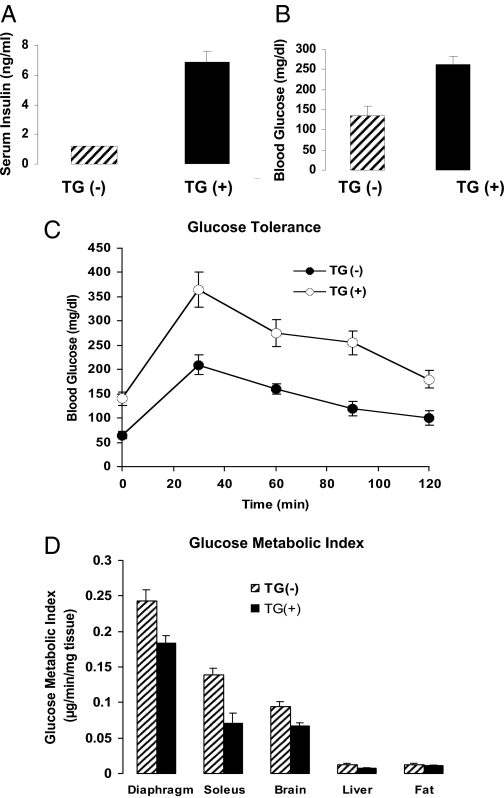
Figure 5.
Studies in PC-1 transgenic mice. Insulin (A) and glucose (B) levels in 10 PC-1 transgenic (TG+) vs. 10 control mice (TG−). C, Glucose tolerance tests (five per group). D, Glucose metabolic index in tissues of transgenic animals overexpressing PC-1. Animals were given a constant insulin infusion, and the uptake of 2-[14C]DG was measured in various tissues (seven control and five transgenic). In transgenic animals, glucose uptake (Rg) was significantly decreased in diaphragm and soleus muscles and brain. [Adapted with permission from B. A. Maddux et al.: Am J Physiol Endocrinol Metab 290:E746–E749, 2006 (57).]

