Figure 8.
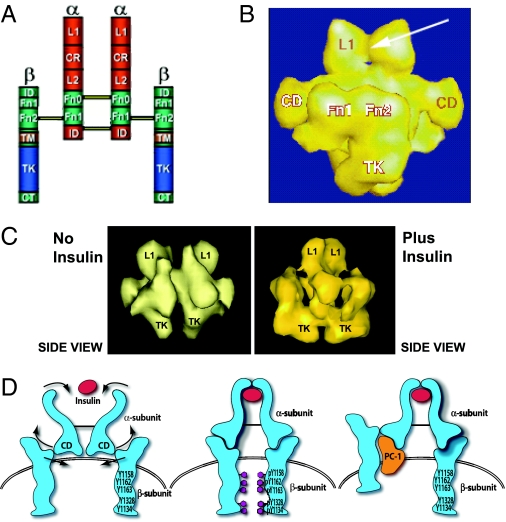
Traditional and STEM models of the IR. A, Traditional model of the IR with the major domains shown. The following regions are indicated: α-subunit domains: L1, long 1; CR, cysteine-rich; L2, long 2; α Fn 0, α fibronectin 0; α Fn 1, α Fibronectin 1; ID, insert-domain. β-subunit domains: ID, insert-domain; β Fn 1, β fibronectin 1; β Fn 2, β fibronectin 2; TM, transmembrane; TK, tyrosine-kinase; CT, C-terminal. B, Three-dimensional reconstruction (side view) from STEM. The arrow indicates the insulin-binding site at the L1 domains. The Fn 1, Fn 2, and TK domains of the β-subunit are shown. C, STEM data showing the effect of insulin binding to move the β-subunits. D, Model of proposed activation of the IR β-subunit by the CD. The CD is a connecting domain in the IR α-subunit that includes residues 485–599. In this model insulin binds to the α-subunit to activate the CDs which then move the β-subunits together to facilitate transphosphorylation. When PC-1 binds to the CD it blocks the movement of the β-subunits induced by insulin. [Derived from C. C. Yip and P. Ottensmeyer: Biol Chem 278:27329–27332, 2003 (126).]

