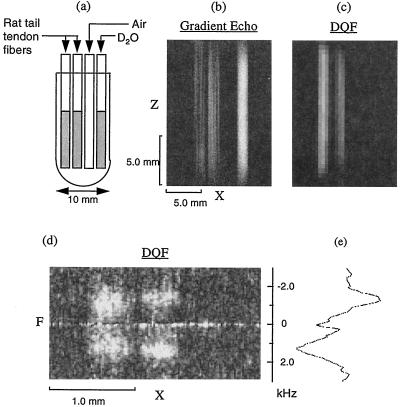
Figure 2.
2H DQF-SI of rat tail tendon fibers. (a) A scheme of the sample. The sample consists of four capillaries (1.2-mm inner diameter): each of the left two contains 5–7 fibers of rat tail tendon immersed in 150 mM NaCl/D2O, the third from the left is empty, and the rightmost is filled with D2O. (b) 2H GE 2D image of the XZ plane. Field of view is 15 × 15 mm2, data matrix 1282, slice thickness 5 mm, repetition time (TR) = 300 ms, time to echo (TE) = 3.3 ms. (c) 2H DQF 2D image at a creation time of 0.2 ms, constructed by projecting the spectroscopic dimension onto the XZ plane. Field of view is 15 × 15 mm2 × 6.0 kHz, data matrix 32 × 32 × 256, TR = 1 s, DQ evolution time 5 ms. Note that the brighter regions in the GE image (b) correspond to the regions containing free D2O in the spaces between the fibers and in the capillary containing pure D2O, whereas only intrafibrillar water is apparent in the DQF image (c). In d a 1D DQF SI of two rat tail tendon fibers (0.5-mm diameter immersed in D2O in a single capillary acquired with a field gradient strength of 190 G/cm. The X and F axes stand for the spatial and the spectroscopic dimensions, respectively. (e) One of the DQF spectral lines located at the center of the right fibers. The DQF images were acquired with τ = 0.3 ms.

