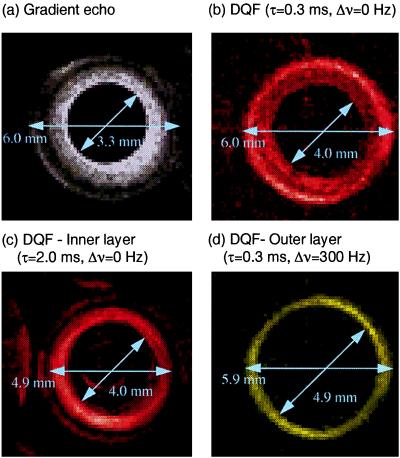
Figure 4.
Histological images of a cross-section bovine coronary artery. A piece of coronary artery (ca. 6 mm outer diameter and a length of 12 mm) was equilibrated in D2O saline. A polyacrilamide rod (3.3-mm diameter) was inserted in the vascular lumen, and both ends of the artery were tied with silk threads.The axis of the artery was set parallel to the magnetic field. (a) A 2D 2H GE image of the artery. The image mostly corresponds to the free water in the space between the rod and the tissue, which remained to prevent magnetic susceptibility artifacts. Field of view 10 × 10 mm2, data matrix 1282, slice thickness 10 mm, TR = 200 ms, TE = 3.3 ms. (b–d) 2D 2H DQF spectroscopic images constructed for a width of 100 Hz in the spectroscopic dimension. The use of different colors (red for ν = 0 Hz and yellow for ν = 300 Hz) emphasizes the fact that the images were taken from different frequency regions. (b) 2D 2H DQF SI image measured at τ = 0.3 ms and frequency of 0 Hz in the spectroscopic dimension. The image consists of water in all layers of artery, but water in the lumen is completely suppressed. (c) 2D 2H DQF SI image measured at τ = 2.0 ms and ν = 0 Hz in the spectroscopic dimension. Only the water in the inner layer (tunica media) is depicted, and the thickness of the inner layer is 0.9 mm. (d) 2D 2H DQF SI image measured at τ = 0.3 ms and ν = 300 Hz in the spectroscopic dimension. Only the water in the outer layer (tunica adventitia) is depicted, and the thickness of the layer is 1.0 mm. Parameters used for 2D 2H DQF SI are as follows: field of view 7.5 × 7.5 mm2 × 6.0 kHz, data matrix 52 × 52 × 256, TR = 1 s.

