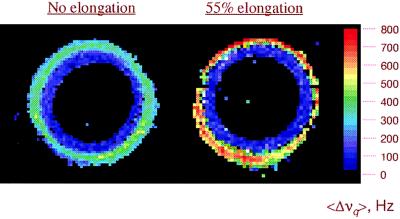
Figure 5.
Two images that display a 2D map of the average 2H quadrupolar splitting, <Δνq>, of a bovine coronary artery, unstressed (Left) and 55% elongated (Right). In the magnet the artery, originally equilibrated in D2O, was aligned with the external magnetic field. <Δνq> was calculated by using 256 spectral points for each of the (64 × 64) pixels of the 2H DQF spectroscopic data sets. The left image was acquired by using TR = 1 s, τ = 0.3 ms. To optimize the signal-to-noise ratio for both tissue layers, the right image was calculated by combining two sets of data: for the outer layer, data were acquired by using TR = 0.1 s and τ = 0.3 ms, and for the inner layer, data were acquired by using TR = 0.1 s, τ = 2.0 ms. The field of view of both images was 0.75 cm.

