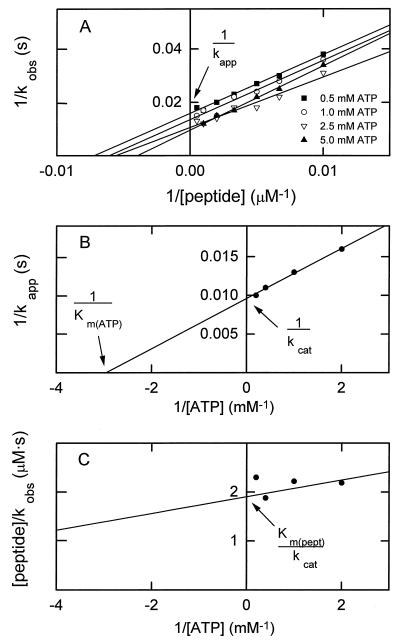
Figure 2.
Illustration of the method used for determining kcat, Km(peptide), and Km(ATP) for expressed wt and mutant catalytic domain of myosin I heavy chain kinase. The data shown are for the T632A mutant (Table 1). (A) A double reciprocal plot of the enzymatic activities (kobs) determined as a function of peptide concentration at four concentrations of ATP. The slope of the line for 5.0 mM ATP (but not kcat) was consistently less than the slopes at the three lower concentrations of ATP, suggesting the possibility of substrate (ATP) inhibition that is reversed by high concentrations of the second substrate (peptide). (B) A double reciprocal plot of the values for kapp estimated from A as a function of the ATP concentration. (C) A double-reciprocal plot of the slopes of the lines in A as a function of ATP concentration.

