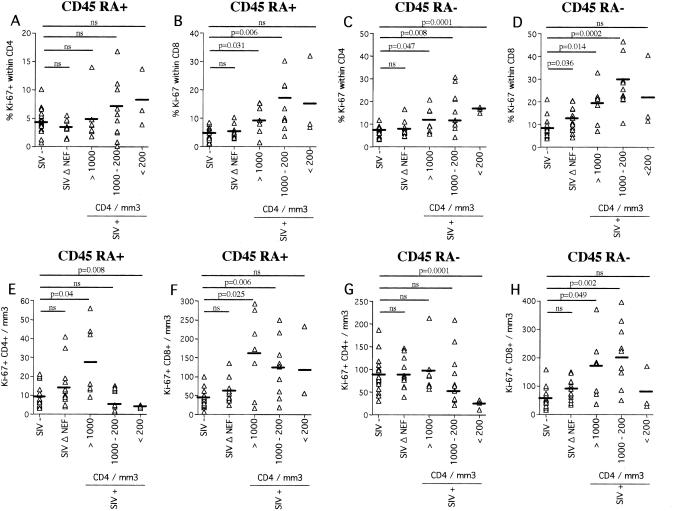
FIG. 2.
Proportions (A to D) and numbers (E to H) of CD4+ and CD8+ T cells expressing CD45RA and Ki67. Four-color flow cytometry was performed on peripheral blood mononuclear cells from uninfected (SIV-), SIVmac251Δnef-infected (SIV Δ NEF), and SIVmac251-infected (SIV+) macaques. SIV+ animals were divided into groups according to the numbers of circulating CD4+ T cells (>1,000, n = 7; 1,000 to 200, n = 10; <200, n = 3). Each symbol represents an individual result. Significance was assessed using Student's t test (ns, no statistically significant difference). The horizontal bars indicate mean values.

