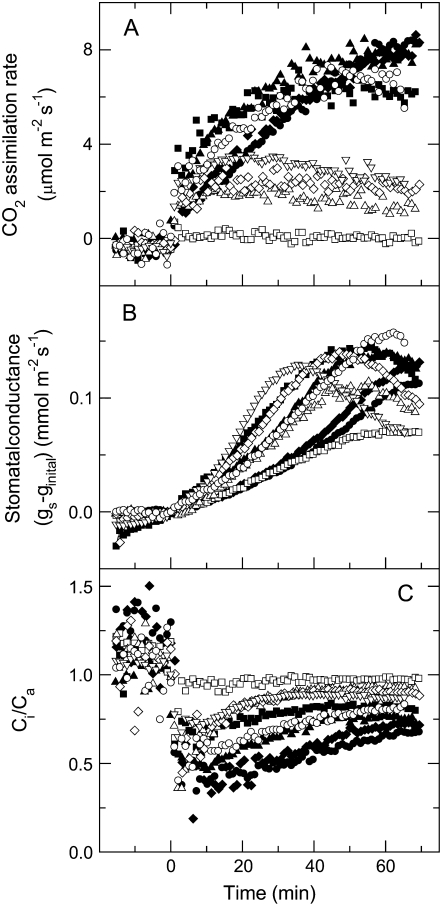
Figure 2.
A to C, Kinetics of CO2 assimilation rate (A), leaf conductance (B), and the ratio of intercellular to ambient CO2 (Ci/Ca; C) in wild-type plants (black symbols) and a range of anti-b/f plants with different cytochrome b6f contents (white symbols), during illumination of dark acclimated leaves at an irradiance of 1,000 μmol photons m−2 s−1 of red light. Symbols of different shape (white or black) represent measurements made on different plants. Light was turned on at time 0. Measurements were conducted at 362 μmol mol−1 CO2, a leaf temperature of 25°C, and a leaf chamber humidity of 19 mbar. Leaves were acclimated in the dark for a minimum of 20 min before the measurements. Stomatal conductance (gs) was normalized by subtracting the conductance values at time 0 (ginitial), which ranged between 0.006 and 0.035 mol m−2 s−1.

