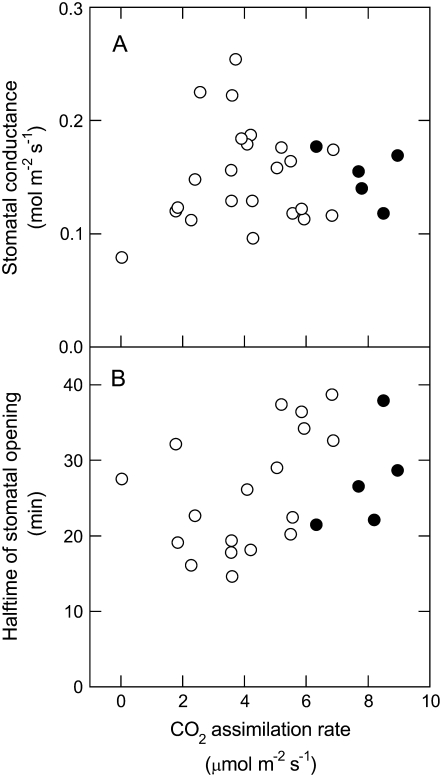
Figure 4.
Relationship between maximal stomatal conductance and CO2 assimilation rate in wild-type and anti-b/f tobacco measured under red light. A, Stomatal conductance. B, Half-times of stomatal opening. Experimental conditions were the same as for Figure 2. Each point corresponds to a different plant. Black circles, wild-type plants; white circles, anti-b/f plants. Half-times were calculated as the time taken to reach half the maximal conductance from the time the light was turned on.

