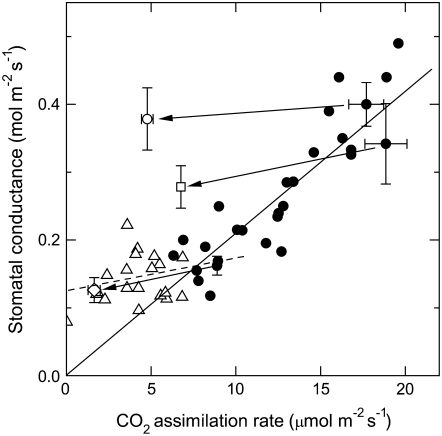
Figure 7.
Relationship between stomatal conductance and CO2 assimilation rate in wild-type and transgenic tobacco plants impaired in photosynthesis either by a decrease in electron transport rates (anti-b/f plants) or in Rubisco function (anti-SSU plants). Plants were grown under elevated CO2 in environmentally controlled chambers and conductance and photosynthesis measurements were performed under ambient CO2. Black circles, wild type; white triangles, anti-b/f plants; white diamond, mean ± se (n = 4) from LL-grown anti-SSU plants; white square, mean ± se (n = 4) of ML-grown anti-SSU plants; white circle, mean ± se (n = 5) from ML-grown anti-SSU plants assayed in red-blue light (von Caemmerer et al., 2004). Arrows link data from anti-SSU plants with the mean ± se of four to five wild-type plants grown and assayed under identical conditions at the same time. The solid and dashed lines represent the linear regression fit of all wild-type data (y = 0.0217 (±0.00069) × x, R = 0.90), and LL-grown wild-type and anti-b/f data as shown in Figure 4A (y = 0.1209 (±0.0159) + 0.00514 (±0.0 29) × x, R = 0.34), respectively. Each data point not showing error bars corresponds to an individual plant. Error bars represent se.

