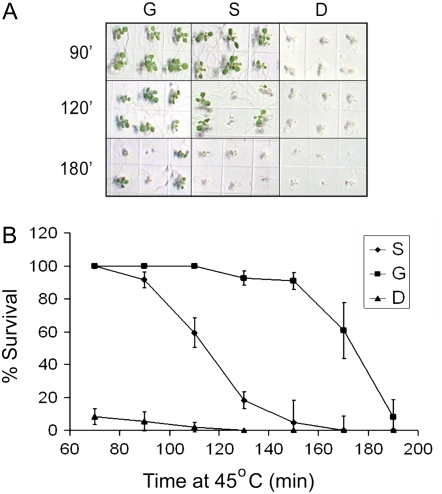
Figure 2.
Thermotolerance of plants given different heat treatments. Percent survival of 7-d-old seedlings acclimated (G and S) or not (D) as shown in Figure 1 and then treated at 45°C for the indicated time. A, Appearance of plants at the time of scoring for viability after the indicated heat treatments. B, Graph showing numerical data. Error bars represent sd from three replicate experiments. [See online article for color version of this figure.]

