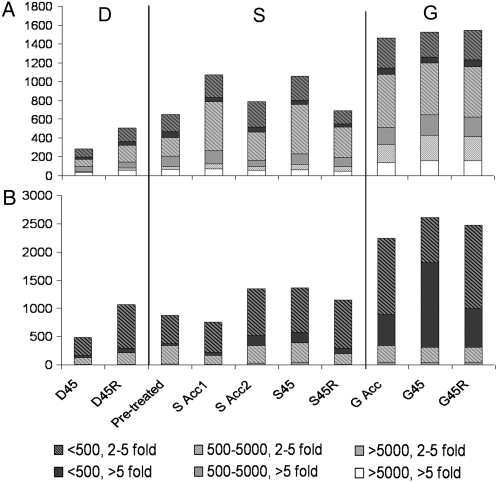
Figure 3.
Large numbers of transcripts are increased or decreased by heat treatment. Number of transcripts increased (A) or decreased (B) at the indicated sampling time points as defined in Figure 1. Bars are divided to show classes of transcripts with 2- to 5-fold or >5-fold change in level and to show different absolute expression levels (<500, 500–5,000, >5,000 AU).

