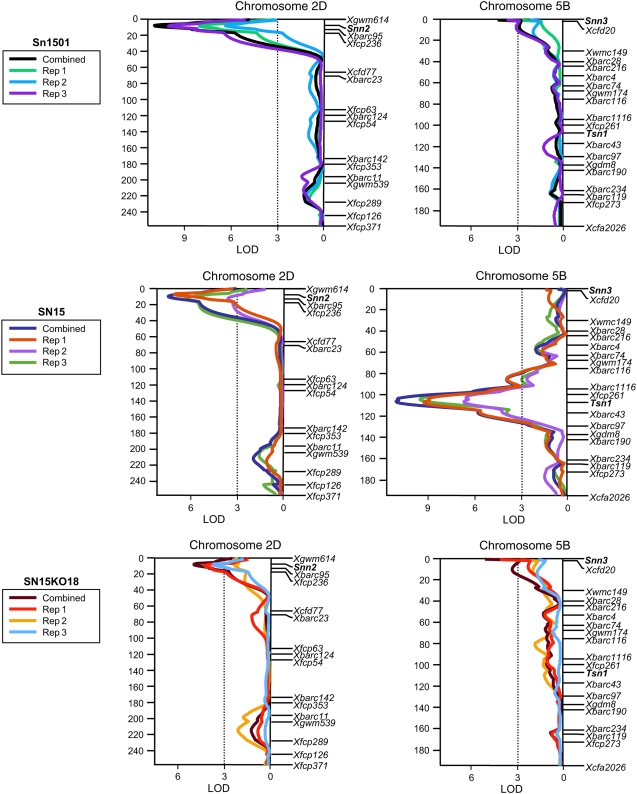
Figure 5.
Interval regression analysis of chromosomes 2D and 5B for reaction to SNLB produced by S. nodorum isolates Sn1501, SN15, and SN15KO18. Analyses of replicates 1, 2, and 3 and the combined means for each isolate are indicated by different colored lines as depicted in the boxes to the left of the maps for each isolate. A centiMorgan scale is indicated to the left of the maps, and markers are shown in their relative positions along the right. An LOD scale is shown along the x axis, and the critical LOD threshold of 3.0 is indicated by the dotted line.

