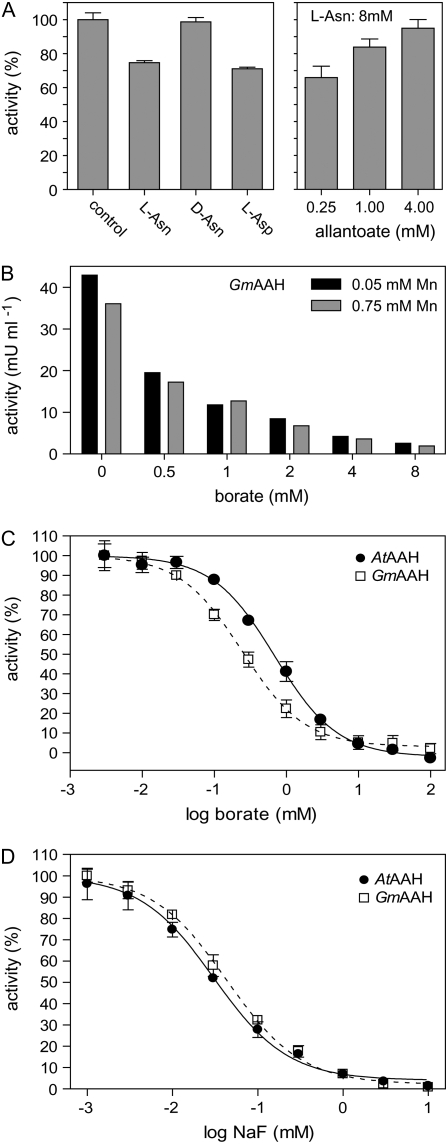
Figure 4.
Inhibition studies. A, Inhibition of GmAAH by l-Asn, d-Asn, and l-Asp (8 mm each) and suppression of l-Asn inhibition by increasing substrate concentrations. Error bars are sd (n = 3). B, Inhibition of GmAAH by increasing concentrations of borate in the presence of limiting (50 μm) or abundant (750 μm) manganese concentrations. C, Borate inhibition curve for AtAAH and GmAAH fitted using a sigmoidal dose response equation (R2 = 0.99 for both). Error bars are sd (n = 3). D, Fluoride inhibition curve of AtAAH and GmAAH fitted using a sigmoidal dose response equation (R2 = 0.99 for both). Error bars are sd (n = 3).

