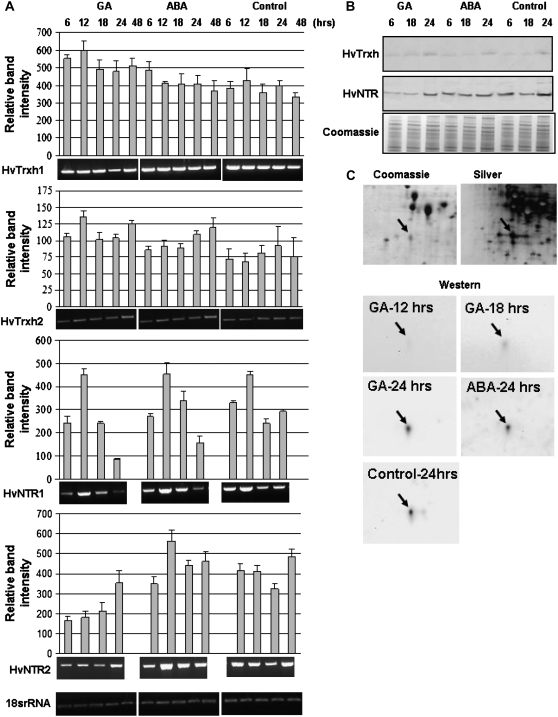
Figure 3.
Gene expression and protein appearance for Trx h and NTR isoforms in aleurone layers responding to GA, ABA, and buffer without hormones (control) at various time points (6–48 h). A, RT-PCR analysis of HvTrxh1, HvTrxh2, HvNTR1, and HvNTR2. One representative gel is shown from three independent replicates. Relative band intensities were normalized to18S rRNA band intensity (100%). Each data point represents the mean ± sd obtained from three independent RT-PCR reactions. B, Western blot of aleurone protein extracts using antibodies against Trx h and NTR. C, Coomassie- and silver-stained 2-D gels and 2-D western blotting using Trx h antibody in aleurone layers treated in the presence and absence of GA and ABA. The Trx h spot is marked by an arrow.

