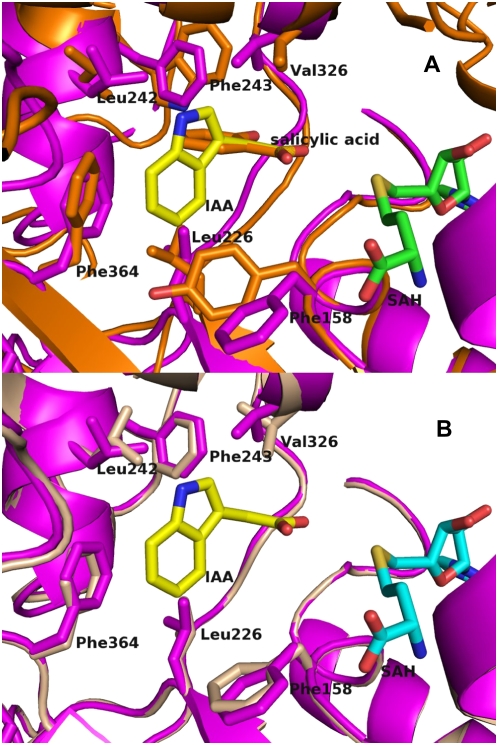
Figure 8.
A, Comparison of AtIAMT (magenta) and CbSAMT (orange) active sites. B, Comparison of the active sites of AtIAMT1 (magenta) and a homology model of OsIAMT1 (wheat). The latter was calculated with a modeler (Sali and Blundell, 1993) based on the experimentally determined AtIAMT1 structure (magenta). Secondary structures are represented as ribbons and most of the active-site residues involved in substrate recognition are represented as filled and color-coded bonds. SAH is represented as green sticks, IAA as yellow sticks, and SAH as orange sticks. This figure was produced with PyMOL (http://www.pymol.org).

