Figure 2.
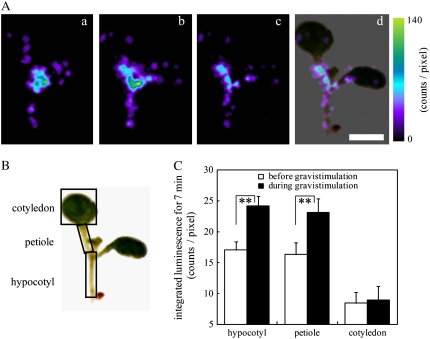
Increases in [Ca2+]c induced by gravistimulation in hypocotyls and petioles. A, [Ca2+]c-dependent aequorin luminescence from a whole seedling was integrated for 7 min before and during gravistimulation (180° rotation) using an ultrasensitive PCC system. Typical images with pseudocolor before (a) and during (b) gravistimulation, the subtracted (c; b − a), and the overlaid image with a bright-field image (d) are shown. The color scale indicates photon counts per pixel. B and C, Quantitative analysis with averaging the integrated luminescence intensities at each pixel in three regions (hypocotyls, petioles, and cotyledons) before (white bar) and during (black bar) gravistimulation. Data represent means ± ses (n = 40). **, Statistically significant differences (P < 0.05, the two-tailed Student's t test). Scale bar = 2 mm.

