Figure 3.
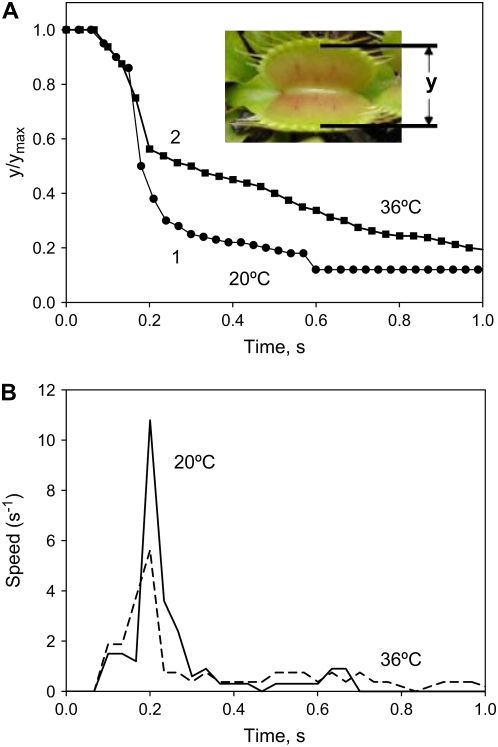
Kinetics of trap closure at 20°C (1) and 36°C (2) applying a 14-μC charge injection to the midrib; y is the distance between the edges of the lobes. A, Dependencies of distances between the edges of the lobes at 20°C (1) and 36°C (2) on time after electrical stimulation. B, Dependencies of the speed of trap closure  on time after electrical stimulation at 20°C (solid line) and 36°C (dashed line). [See online article for color version of this figure.]

