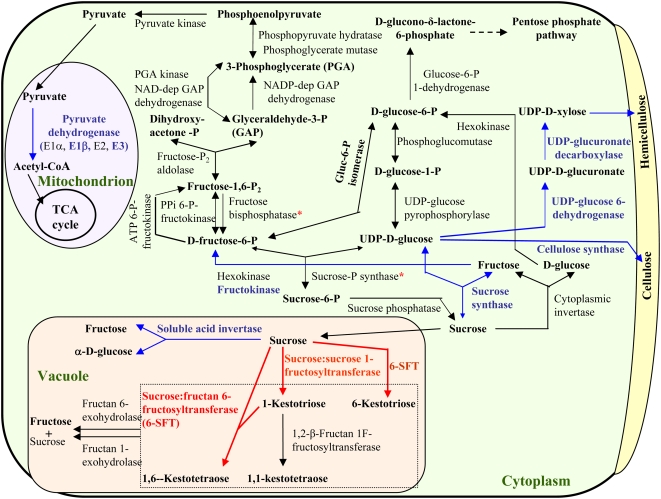
Figure 4.
Illustration of major WSC metabolic pathways and WSC-correlated enzyme families. The total mRNA levels of individual enzyme families were determined by Affymetrix GeneChip analysis as shown in Table I. Red color indicates enzyme families with the total mRNA levels positively correlated with stem WSC concentrations; blue indicates enzyme families with the total mRNA levels inversely correlated with WSCs; black indicates enzyme families that showed no significant correlations. The asterisks (*) show potentially positively WSC-correlated enzyme families (see description in “Results”).

