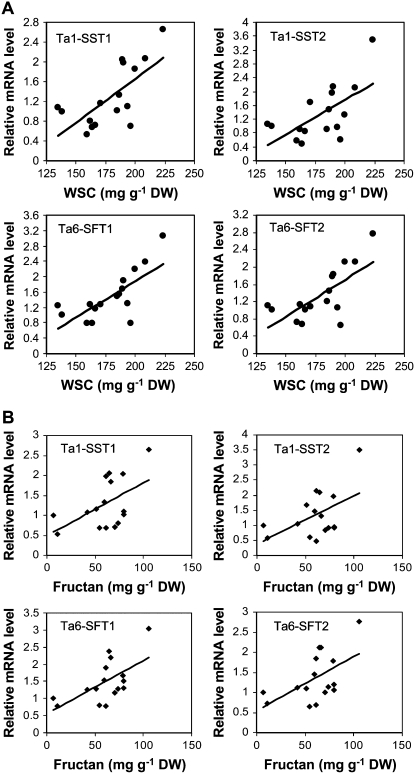
Figure 5.
Fructosyltransferase genes positively correlated with stem WSC (A) and fructan (B) concentrations in 16 SB lines. Relative expression levels of individual genes were determined by quantitative RT-PCR. Each value is the mean of two field replicate samples. Correlations between the expression levels of these genes and WSC or fructan concentrations are all statistically significant (P < 0.05). Ta1-SST1 gene is not present in the Affymetrix GeneChip. TC number of each gene is provided in Supplemental Table S3. DW, Dry weight.

