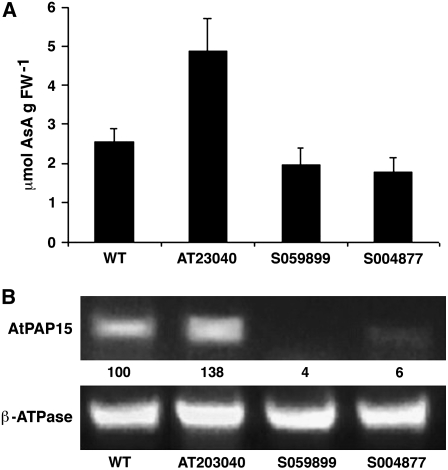
Figure 2.
Foliar AsA and expression of AtPAP15 in AT mutant and T-DNA insertion lines. A, Total foliar AsA in the wild type (WT), the AT mutant (AT23040), and two independent insertion mutants (S059899 and S004877). Bars represent the mean (n = 4) and 1 sd. B, Relative RT-PCR of AtPAP15 expression in the wild type and mutant lines. β-ATPase was used as the loading control. PCR cycles were 28 for AtPAP15 and 25 for β-ATPase. RT-PCR products were detected by staining with ethidium bromide. The AtPAP15 signal was first normalized to the β-ATPase signal and then compared with the wild type. Relative AtPAP15 intensities are analyzed with ImageJ (http://rsb.info.nih.gov/ij/) and shown under each lane as the percentage of signal relative to that in the wild type.

