
Figure 7. Comparison of direct and indirect alloantigen presentation with one versus two HLA-DR mismatches in generating anergy.
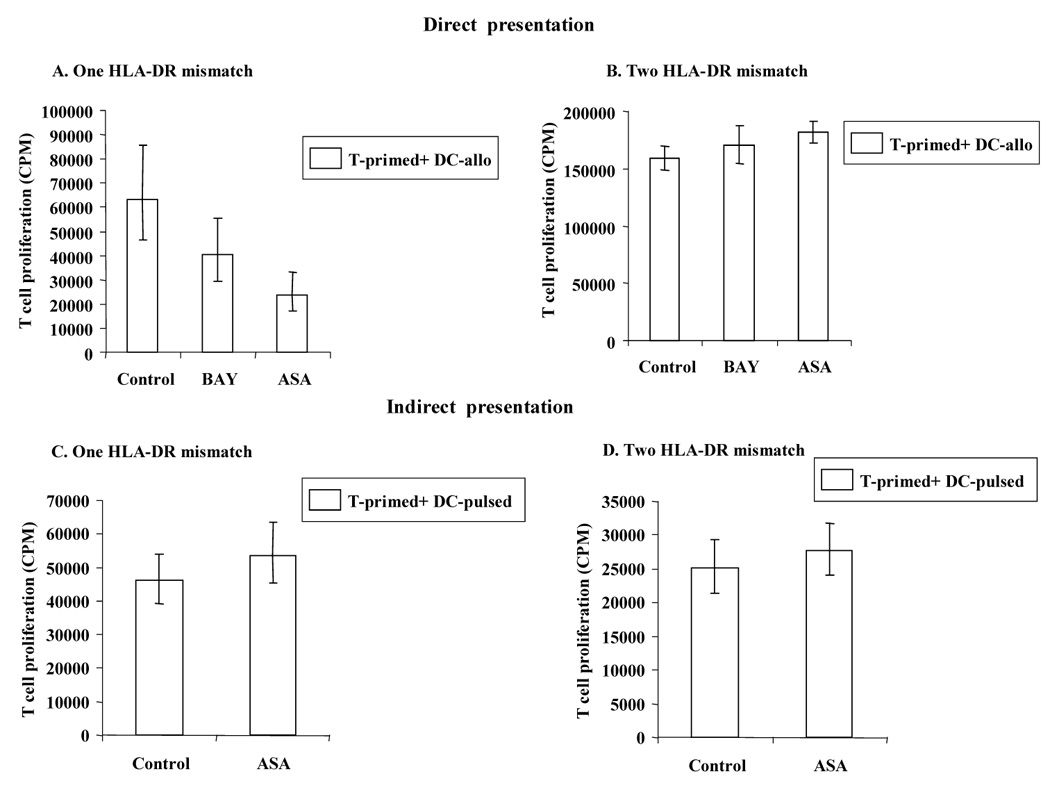
In the direct allopresentation experiment (A, B), after 5 days of coculture with Control- DC, BAY-DC or ASA-DC (condition shown on x-axis), T cells were harvested and restimulated with fresh irradiated DC (DC allo) from the same donor, in a ratio of 10:1 T:DC. Cells were plated in triplicate and T cell proliferation was measured by [³H] thymidine incorporation on day 3 (optimal time point, data not shown). A. Using ASA-DC with one HLA-DR mismatch T cell unresponsiveness/anergy was induced (p values: BAY-DC = 0.01 and ASA-DC < 0.0001). B. BAY-DC or ASA-DC with two HLA-DR mismatches do not induce T cell anergy (p value: BAY-DC = 0.96). However, in some experiments, T cells primed with ASA-DC yielded greater proliferation than Control-DC (p = 0.01). In the indirect allopresentation experiment (C, D), T cells were stimulated with Control- DC, or ASA-DC (condition shown on x-axis) that were pulsed either with one HLA-DR mismatch or two HLA-DR mismatches. After 5 days, the primed T cells were cocultured with fresh autologous control DC pulsed with alloantigen (DC-pulsed) as described above, in a ratio of 10:1 T:DC. Cells were plated in triplicate and T cell proliferation was measured by [³H] thymidine incorporation on day 3. C–D: ASA-DC either with one or two HLA-DR mismatches do not induce T cell anergy (p values = 0.3 and 0.4 respectively). In some experiments, same as described in B, T cells primed with ASA-DC yielded greater proliferation than Control-DC. The open columms represent the geometric means, across experiments and replications within experiment (A: n =6, B: n= 5, C: n= 7 and D: n= 7). N represents the number of experiments, and the total sample size was equal to n times the number of replicates performed within each experiment. Standard error bars of each group of sample are shown above and below the vertical bars.