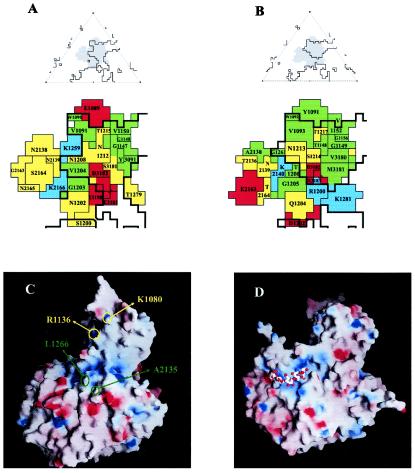
FIG. 4.
The putative receptor binding sites in SVDV SPA/2/'93 (A) Roadmap diagram of the CAR footprint on the surface of CVB3 (PDB code 1JEW) (22). On the top is an icosahedral asymmetric unit with the footprints shown as grey shadows and the limits of the canyon shown as black outlines. On the bottom are residues defining the CAR footprint. Basic amino acids are shown in blue, acidic amino acids are shown in red, hydrophobic amino acids are shown in green, and polar amino acids in yellow. (B) Projected footprint of CAR on the SVDV surface after superimposition of the cryo-EM structure of the CVB3-CAR complex on the crystal structure of SVDV. Coloring and top-bottom representations as in A. (C) Electrostatic accessible surface representation for the biological protomer of SVDV calculated with GRASP (39). The electrostatic potential with positive charge was colored in blue and that with negative charge in red. The position of the residues (I1266 and A2135) substituted in all SVDV mutants lacking the ability to bind heparin are indicated in green. These residues are adjacent to a region of positively electrostatic charge, the candidate to be the HS binding site in SVDV. The basic residues R1236 and K1080 which would define a second putative binding site for HS proteoglycans near the fivefold axis are indicated in yellow. (D) Electrostatic accessible surface representation for the biological protomer of FMDV type O in complex, with HS (PDB entry code 1QQP) (17) shown for comparison. The bound HS molecule (represented by sticks) is located within a slight depression of positively charged residues making contacts with all three major capsid proteins. The FMDV and SVDV capsid surfaces differ from each other both in shape and in charge distributions. This may explain why the predicted HS binding site of SVDV does not overlap the FMDV HS binding site.

