
Figure 1.
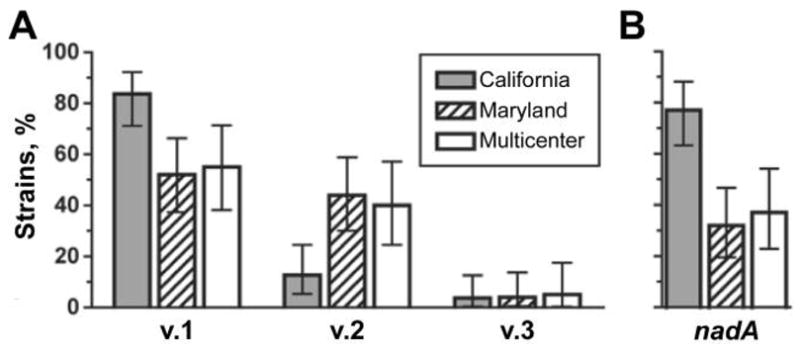
Percentage of fHBP variant (v.) 1, 2, or 3 genes (A) and nadA genes (B), as determined by quantitative polymerase chain reaction. Error bars indicate 95% confidence intervals. Shaded bars, California isolates; hatched bars, Maryland isolates; white bars, multicenter isolates.