
Fig. 1.
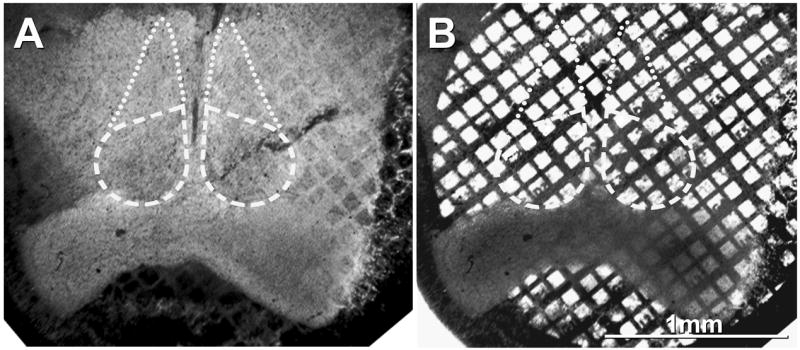
Confocal grid-map showing low-magnification immunofluorescence image (A) and bright-field image (B) of rat SCN on gold electron microscope “index” grid. All neuronal gap junctions found in this study were traced to their approximate locations on their respective photomaps and are plotted on a composite map as Figure 9.