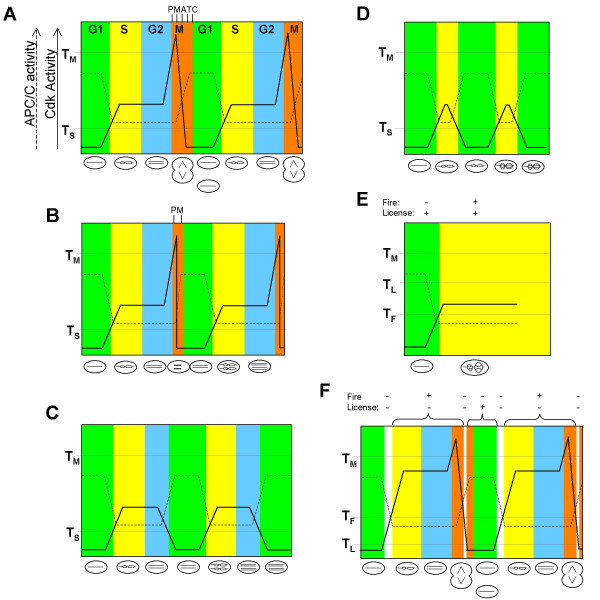
Figure 2.
Quantitative model of Cdk activity applied to normal and over-replicating cell cycles. Cdk (continuous line) and APC/C (broken line) activities (y-axis) are plotted against time (x-axis). TM, TS, TL and TF indicate thresholds of Cdk activity, as defined in the text. P,M,A,T and C: prometaphase, metaphase, anaphase telophase and cytokinesis, respectively. A. Normal cycle. B. Endoreduplication from mitosis. C. Endoreduplication from G2. D. Endoreduplication from S-phase. E. Re-replication. F. Normal cell cycle with periods of insulation (white segments) when origins can neither be licensed nor fire. Fire +/- = sufficient/insufficient Cdk to promote origin firing. License +/- = sufficient/insufficient Cdk to prevent licensing.

