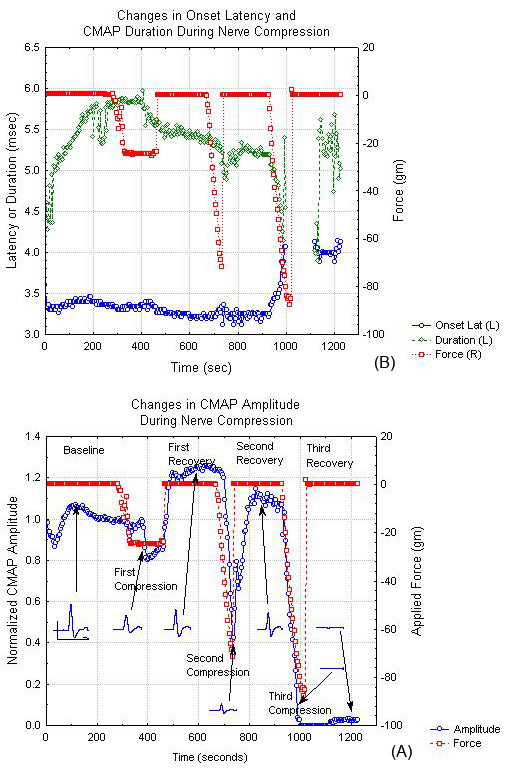
Figure 2.

CMAP parameters and nerve compression tension as a function of time during a typical nerve compression experiment. (A) Changes in CMAP amplitude and CMAP waveform. (B) Changes in CMAP onset latency and duration. In both cases, the applied force is shown on the right y-axis and the CMAP parameter value on the left y-axis.
