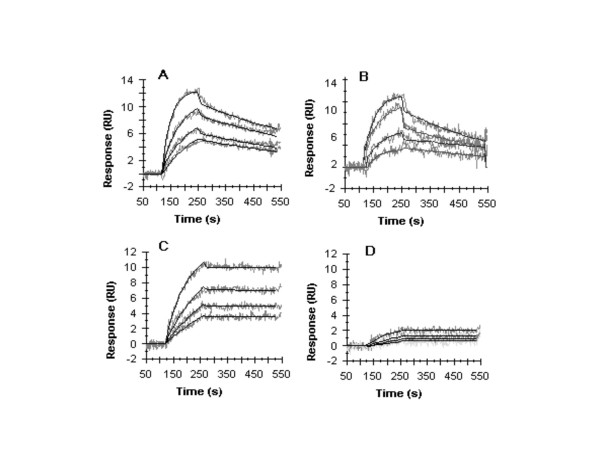
Figure 3.
Binding of Cry1Aa and the mutant toxin F328A to the APN and cadherin-like protein purified from B. mori measured by surface plasmon resonance (SPR) using a Biacore 1000. Representative BIAcore response curves for toxin injections at 200 (lower curve), 300 (second curve from bottom), 500 (third curve from bottom), and 1000 nM (top curve). Experimental curves (grey) are shown overlaid with fitted curves (black) obtained with the 1:1 Langmuir binding model. The same APN-bound chip is used in figures A and B, and the cadherin-bound chip is used in figures C and D. (A) Cry1Aa wt binding to B. mori APN. (B) F328A binding to B. mori APN. (C) Cry1Aa wt binding to B. mori cadherin-like protein. (D) F328A binding to B. mori cadherin-like protein.

