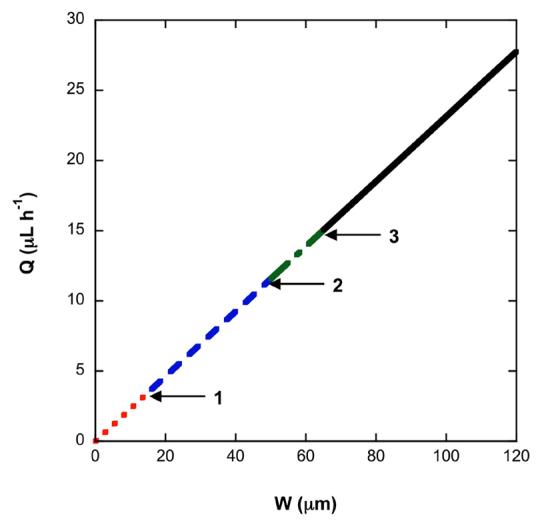
Fig. 6.

Plot of Q versus W from the Ergun equation, assuming an aspect ratio of 5. (1) indicates Q and W for a channel incorporating the minimum mass of silica. (2) indicates Q for a channel that meets the constraint of channel width. (3) indicates W for a channel that meets the constraint on flow rate. The dotted red line indicates solutions that do no meet any design constraints. The dashed blue line indicates solutions that do not meet the constraints W ≥ 50 μm and Q ≥ 15 μL h−1. The dotted-dashed green line indicates solutions that do not meet the constraint Q ≥ 15 μL h−1. The solid black line indicates possible design solutions that meet all constraints, and has an upper bound set by the sample volume.
