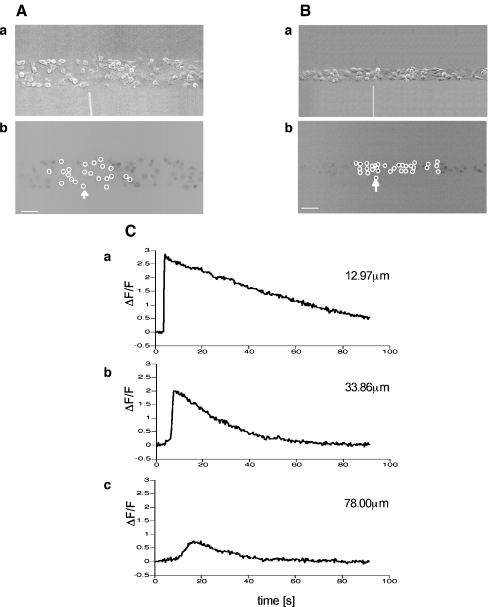
Fig. 2.
The Ca2 + wave propagates along a lane of microglia with decreasing amplitude from the point of initiation. A and B show results for two different lanes of microglia, of widths 82±5  and 38±4
  , respectively. In each case, (a) shows the site of Ca2 + initiation by mechanical stimulation with a micropipette and (b) shows the microglia that responded with a Ca2 + transient (indicated by open circles) after stimulation at the site indicated by the arrow; the calibration bar is 45
  . C shows the timecourse of the Ca2 + wave at different distances along a lane from the site of initiation, as indicated. The mechanical stimulus was applied for 1 s starting at time zero

