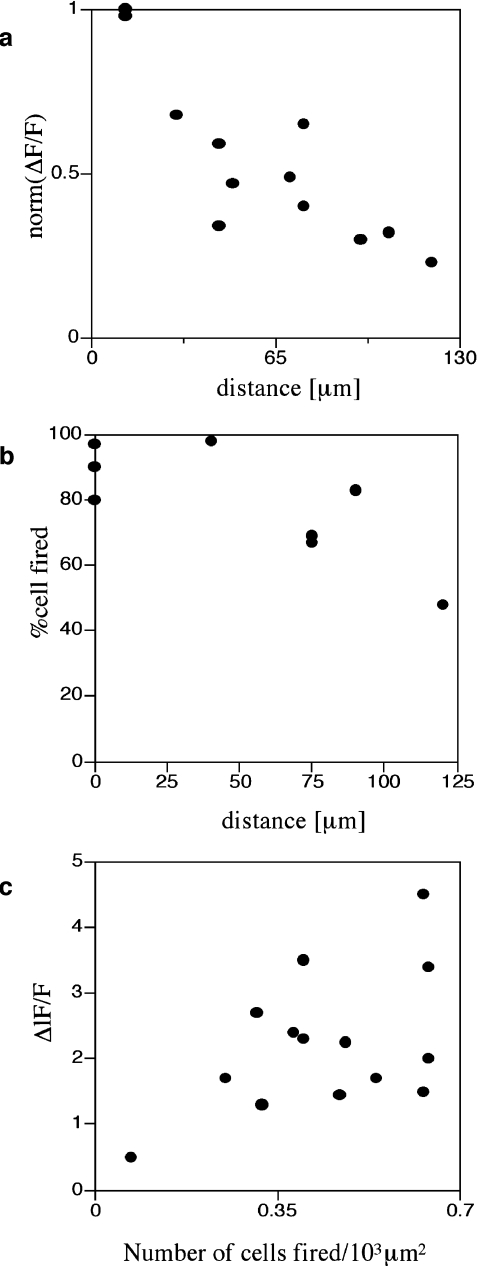
Fig. 3.
Quantitative characteristics of the Ca2 + wave for a number of microglia lanes. a shows the average peak amplitude of Ca2 + deliveries along the lanes before becoming undetectable at about 120  (values normalized to the peak Ca2 + concentration at the stimulating electrode). b shows the number of microglia that give a Ca2 + response at different positions along the length of a lane, expressed as a percentage of the total number of Ca2 + indicator-labeled microglia at that position; this remains high for about 80
  and then declines. c shows that the average amplitude of the peak Ca2 + wave in equal-width segments of a microglia lane increases with the number of microglia that propagate Ca2 + in the segment. Results in a, b and c are for three different lanes in three different cultures. In a and b the distance is from equal-width segments along a lane (for which the average peak Ca2 + was calculated for all microglia in the segment) to the site of mechanical initiation of the Ca2 + wave

