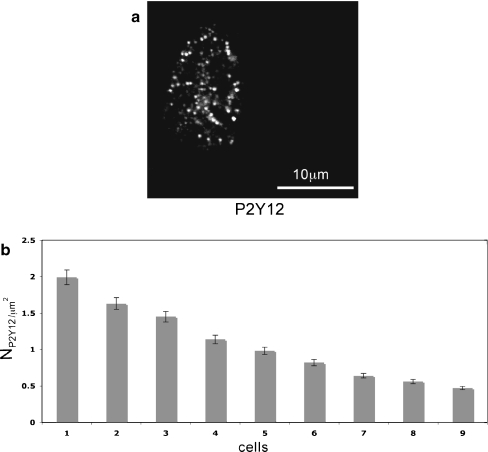
Fig. 7.
Density of P2Y receptors on microglia. a Distribution of anti-P2Y12 receptor immunofluorescence on single spinal-cord microglia in lanes; the shape of the cell is given by the borders of immunohisto chemical staining. b Histogram of the density of and anti-P2Y12 labelled receptors for different microglia. The error bars indicate ±SEM. At least ten areas on each cell were used to determine the P2Y receptor density

