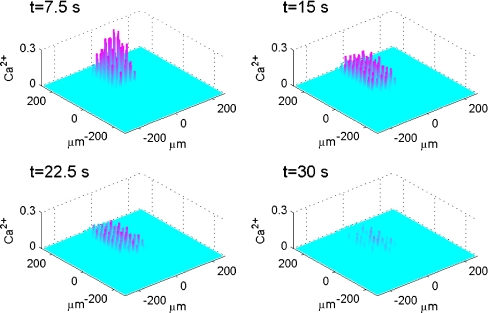
Fig. 8.
Diagrammatic representation of the theoretical spatial and temporal changes in a Ca2 + wave in a lane of microglia five cells wide following excitation of the central microglia, according to the mathematical model. The Ca2 + wave is initiated by a 5-s pulse of ATP of concen tration 20 μM. The vertical bars give Ca2 + in μM at times t = 7.5, 15, 22.5 and 30 s, as indicated. KR values range from 25 to 45 μM for different microglia across each lane

