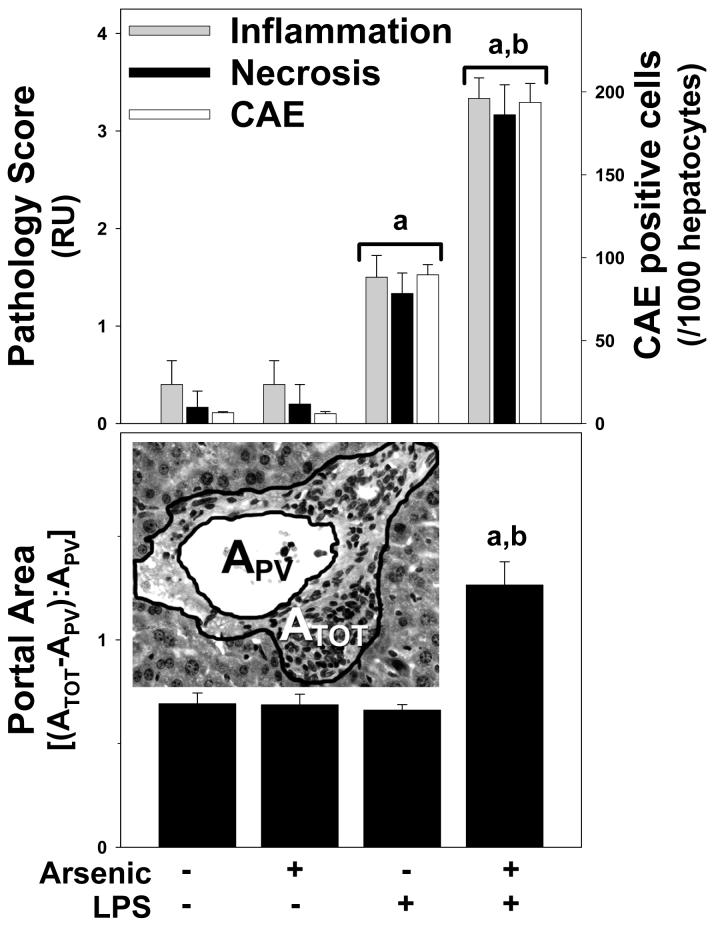
Figure 3. Quantitation of histological changes caused by arsenic and LPS.
Upper panel: Inflammation scores (grey bars), necrosis scores (black bars), and CAE positive cells (black bars) were quantitated as described in Methods. Panel B: Portal expansion was quantitated as described in Methods (see inset). The average size of the portal venules (APV) analyzed was ∼5×10⁻³ mm2 and did not significantly differ between the groups. Data represent means ± SEM (n = 4-6). a, p < 0.05 compared to the saline injection; b, p < 0.05 compared to animals exposed to tap water. Key: RU, relative units; ATOT, total area; APV, portal vessel area.

