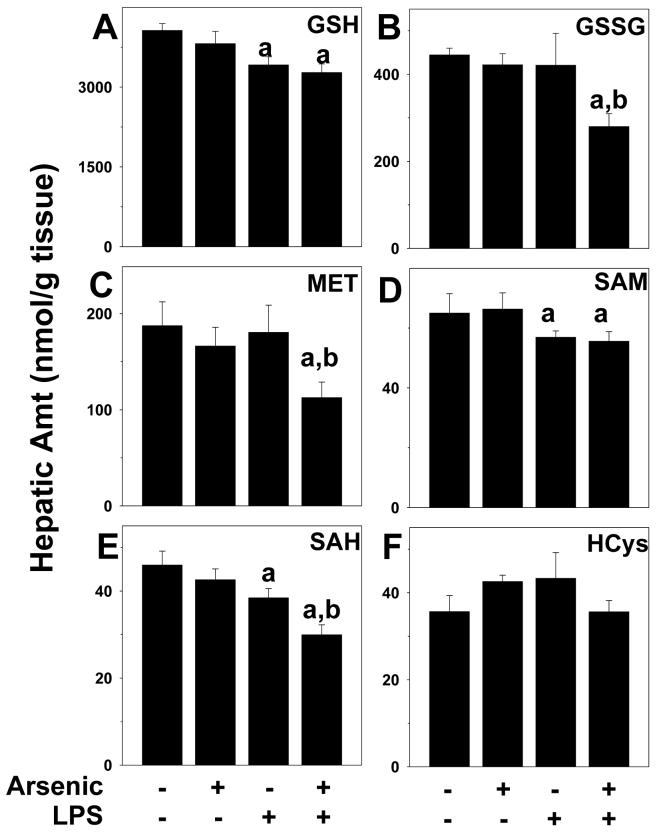
Figure 6. Effect of arsenic and LPS on indices of sulfur and methionine metabolism.
Animals and treatment are as described under Methods. Hepatic levels of reduced (GSH; panel A) and oxidized (GSSG; panel B) glutathione, methionine (MET; panel C), S-adenosylmethionine (SAM; panel D), S-adenosylhomocysteine (SAH; panel E) and homocysteine (HCys; panel F) were determined by HPLC (see Methods). a, p < 0.05 compared to the saline injection; b, p < 0.05 compared to animals exposed to tap water.

