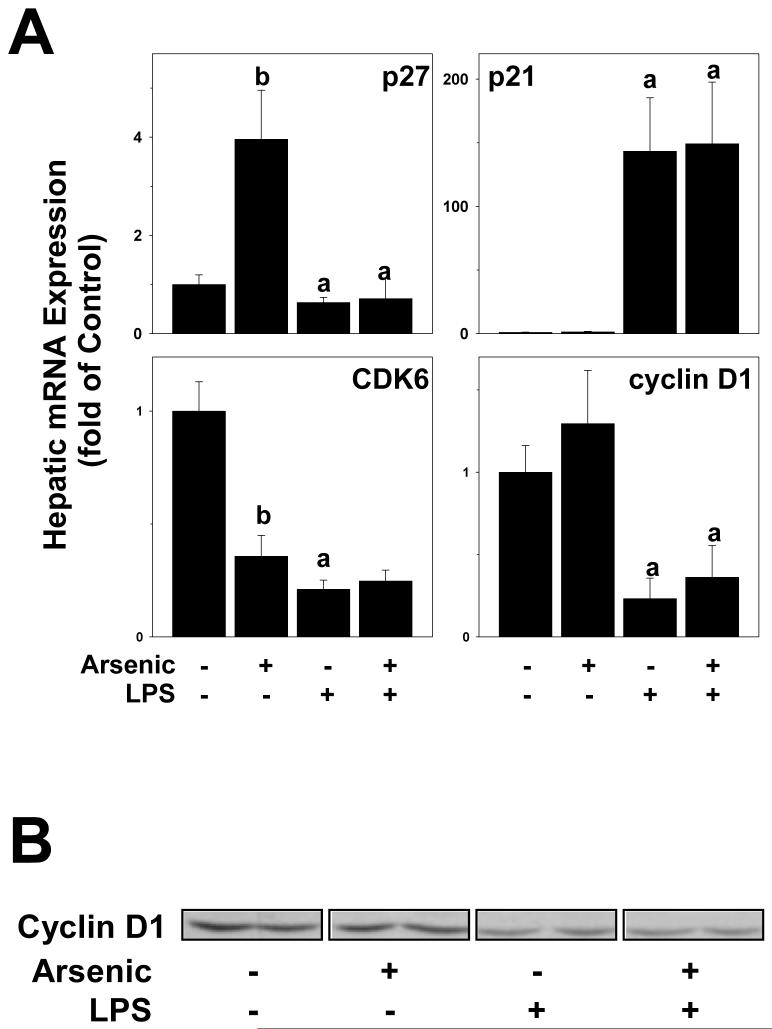
Figure 8. Effect of arsenic and LPS on the expression of Cyclin D1.
Protein levels of cyclin D1 were determined by Western blot. Representative blots (panel A) and summary densitometric quantitation (panel B) are shown. a, p < 0.05 compared to the saline injection; b, p < 0.05 compared to animals exposed to tap water.

