Fig. 4.
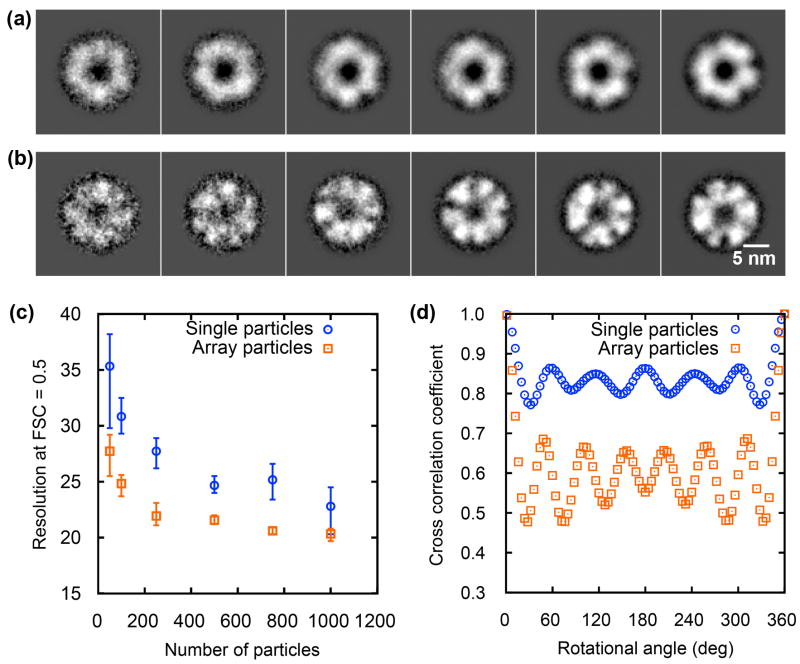
Comparison of image analysis results from single and array particles. (a) Averaged top-view images of proteasomes after alignment using single particle images containing 50, 100, 250, 500, 750, and 1000 protein particles. (b) Averaged top-view images of proteasomes after alignment using array particle images containing the same number of protein particles. (c) Resolution of top-view images averaged over 50–1000 single and array particles. Error bars were obtained by randomly running three different data sets. (d) Cross-correlation coefficient vs. rotational angle for symmetry analysis of averaged top-view images over 1000 single and array particles.

