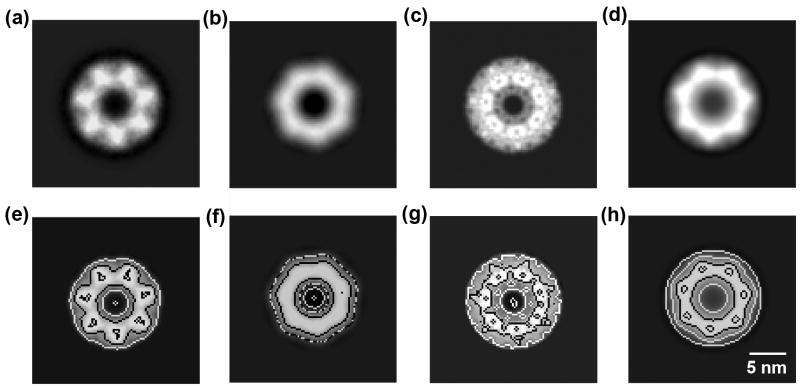
Fig. 5.
Comparison of proteasome top-view images generated by various methods. (a) Averaged image from 1000 array particles after 7-fold symmetry implementation. (b) Averaged image from 1000 single particles after 7-fold symmetry implementation. (c) Top-view image projected from X-ray crystallographic 3D structure (PDB ID: 2FHG) (Hu et al., 2006). (d) Averaged image from tilted top-view projections simulated from 15-Å low-pass filtered X-ray crystallographic 3D structure (Supplementary Fig. 9). (e)–(h) are their corresponding contoured images, respectively.

