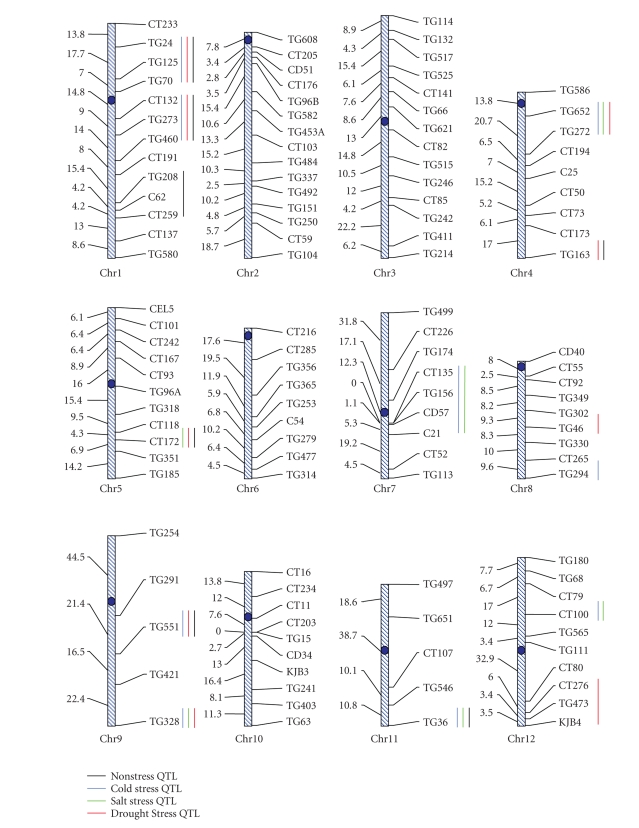
Figure 1.
An RFLP linkage map of the 12 tomato chromosomes constructed based on a BC1 population of a cross between Lycopersicon esculentum (NC84173) and L. pimpinelliforlium (LA722). The names of the markers are shown at the right of the chromosomes. The map position of all markers is shown at the left of the chromosomes (in centiMorgan based on the Kosambi function). The black, blue, green, and red vertical lines at the right of the chromosomes indicate the approximate locations of QTL for germination rate under control (nonstress) and cold-, salt-, and drought-stress conditions, respectively.

