
Figure 2.
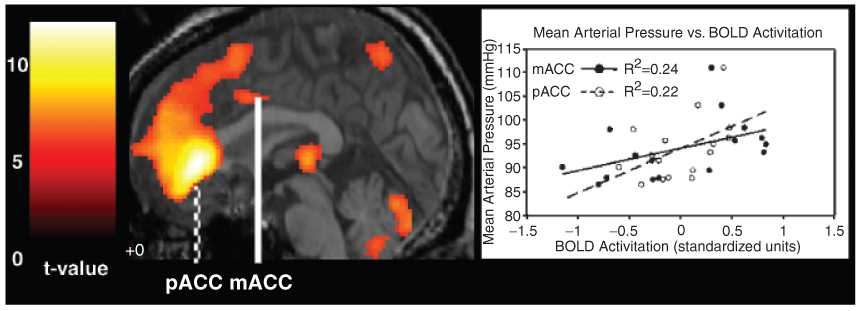
Shown at left are brain regions in which greater hemodynamic BOLD response amplitudes correlated with concurrently greater levels of mean arterial pressure during a Stroop color-word interference task for a single individual. Overlaid on a medial section of this individual’s brain are colored regions that correspond to t values (scaled to the color bar at far left) that were derived from a parametric modulation analysis, which examined the correlation between BOLD response amplitudes and mean arterial pressure. The perigenual (pACC) and mid-anterior (mACC) regions of the cingulate cortex are labeled. Standardized BOLD activation in these two regions are plotted along the x-axis of the scatter plot at right; mean arterial pressure as a function of BOLD activation in these two cingulate regions are plotted along the y-axis.